Case Study Developer Tools
Ollama Stats — Usage Dashboard for Ollama Cloud Keys
Key Result
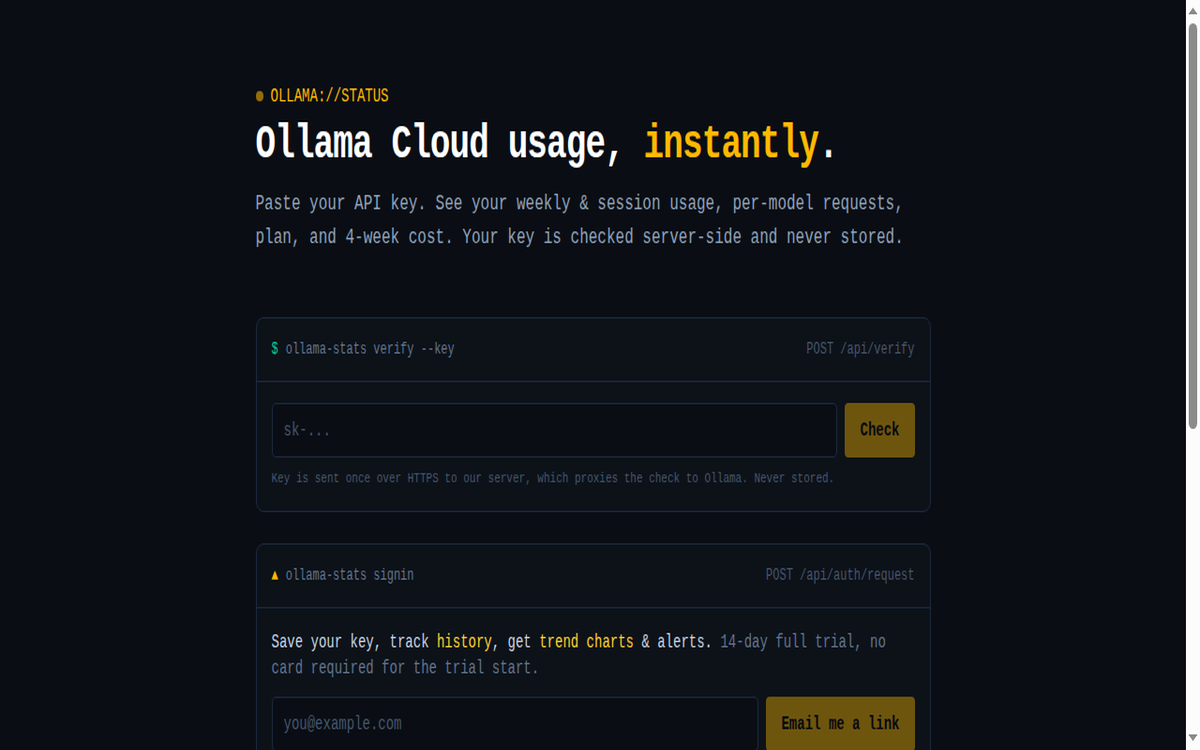
Instant usage, zero signup
0
Accounts Required
4-week
Cost Projection
Per-model
Usage Breakdown
The Challenge
Ollama Cloud users have no native usage dashboard — weekly request counts, per-model breakdowns, and cost exposure stay invisible until the invoice lands. Developers on metered keys need a quick, honest answer to “how much am I using and what will it cost?”
Our Solution
A zero-friction, single-purpose dashboard:
- Paste key, see everything — weekly/session usage, per-model requests, plan tier, 4-week cost projection
- Key stays client-side — used in the browser for API calls, never stored or transmitted elsewhere
- No signup wall — the tool exists to answer one question instantly
- Terminal design language — consistent with the subimpact tools family
Live at ollama.subimpact.net.
Client
Subimpact (own product)
Industry
Developer Tools
Services
Case Study